
Mass transfer in the environment, chemical and bio-transformations, exchange between different environmental media based on compounds physicochemical properties comprise a scientific challenge of great importance with regard to environmental quality assessment and the compound specific engineering interventions for environmental protection and restoration. In addition, the way chemical compounds behave in the environment and distribute within the several environmental media (e.g. between water and soil, or gaseous and particulate phase), is dominant for the identification of mechanisms, pathways and finally routes of human exposure.
Exposure
For many agents that are ubiquitous in several environmental media, total exposure may reflect concurrent contacts with multiple media instead of continuous or multiple contacts with a single medium. Multi-media pollutants give rise to the need to address many types of “multiples” in the quantification of exposure and dose, such as multiple media (air, water, soil); multiple exposure pathways (or scenarios); multiple routes (inhalation, ingestion, dermal); and multiple target tissues for dose and effect.
Thus, aggregate exposure is defined as the quantitative exposure assessment to a single agent from all potential exposure pathways. In contrast, cumulative exposure is defined as the total doses of multiple substances received from multiple sources. In the case that the multiple substances interact at the level of metabolism, then we need to deal with mixtures effects.
Multiple sources and exposure pathways
Figure: Multiple sources and exposure pathways (Sexton et al. 1995)
Exposure pathways define the link between an environmental medium and an exposure medium. An exposure pathway is the course a chemical, biological, or physical agent takes from a known source to an (often unknown) exposed individual. An exposure pathway describes a unique mechanism by which an individual or population is exposed to chemical, biological, or physical agents at or originating from a source.
Each exposure pathway includes a source or release from a source, an exposure point, and an exposure route. Exposure routes are inhalation, ingestion, and dermal uptake. Because exposure is defined in terms of contact with the visible exterior of the organism (skin, mouth and nostrils), we can view a human, an animal, or a plant as having a hypothetical outer boundary separating internal living tissues from the outside surfaces.
Thus, exposure is the condition of a chemical contacting the outer boundary of an organism, and exposure over a period of time can be represented by a time-dependent profile of the exposure-medium concentration. Intake is the process by which a chemical is physically moved through an opening in the outer boundary of an exposed individual. Potential dose is the amount of chemical in the air inhaled, in water or food or ingested, or in a material applied to the skin surface. Absorbed dose is the amount of contaminant penetrating the exchange boundaries of an organism after contact. Absorbed dose is calculated from the intake and absorption efficiency. For human populations, it is typically expressed as the mass of contaminant absorbed into the body per unit mass per unit time, such as mg/kg-day.
Internal dosimetry
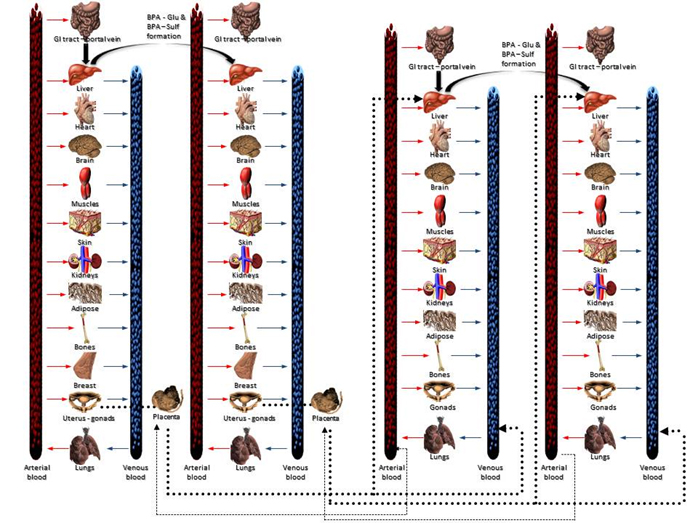
Figure: Generic PBPK Model
Internal dose modeling (which is implemented by PBPK mpdels) provides the quantification links between the administered dose and the time course of the parent compound and the metabolites in tissues and biological fluids. Although it increases significantly the refinement of the overall assessment, should be implemented only in the frame of the highest tier of aggregate exposure assessment because the development of reliable PBPK models is both data and computationally intensive.
Structured criteria might help us to decide when a PBPK model should be implemented in a related study, based on the needs of:
- Biomonitoring data interpretation (inverse dosimetry-exposure pattern reconstruction).
- Overall intake does not always correspond to the biologically effective dose for three main reasons
- differences in bioavailability based on the exposure route
- significant inter-individual variability in response to xenobiotics and
- time profile differences between media concentrations, exposure and biologically effective dose. Moreover, for many xenobiotics the attributable health outcomes are primarily related to the parent compound; in this case, metabolic processes are usually detoxification processes, reducing the overall biologically effective dose of the toxicant. On the contrary, in some xenobiotics like benzene, intermediate metabolites are responsible for observed health outcomes, such as benzene-induced leukemia. In this case, metabolism is a toxicity potentiation process, the relative rate of which may affect the overall toxicity body burden.
Biomonitoring data assimilation
Biomonitoring data represent an integration of exposure from all sources and routes correctly. It can be interpreted to represent short-term exposures as well as cumulative internal dose due to repeated exposures with the knowledge of toxicokinetics and different biomarkers for chemicals. Biomonitoring data makes it feasible to identify metabolic pathways and target metabolites at very low levels of exposure in humans, which is helpful to understand the human toxicokinetics. Moreover, the use of physiologically based pharmacokinetic (PBPK) modeling supports the interpretation of biomonitoring data from the perspective of exposure reconstruction and risk characterization. There are three approaches for linking biomonitoring data to health outcomes: direct comparison to toxicity values, forward dosimetry and reverse dosimetry (Clewell et al. 2008). Biomonitoring data can be directly compared to toxicity values in the case where the relationship of the biomarker to the health effect of concern has been characterized in the human. In forward dosimetry, pharmacokinetic data in the experimental animal can be used to support a direct comparison of internal exposure in humans, providing an estimate of the margin of safety in humans. It is possible to determine the relationship of biomarker concentration to effects observed in animal studies.
Alternatively, reverse dosimetry can be performed to estimate the external exposure that is consistent with the measured biomonitoring data for comparison with an animal-based health standard, such as a Reference Dose (RfD). A typical reverse dosimetry approach uses a physiologically based pharmacokinetic model to identify exposures consistent with human biomonitoring data.
A PBPK model and Monte Carlo simulation are used to predict biomarker concentration distribution at the same assumed exposure level and different exposure patterns and pharmacokinetic parameters; the resulting distribution is then inverted to obtain the exposure conversion factor (ECF). Multiplying the ECF distribution by a measured biomarker concentration results in a distribution of exposure (Tan et al. 2006). In risk characterization, forward dosimetry and reverse dosimetry are complementary to each other. Quantitative interpretation of biomonitoring data can best be accomplished by linking PBPK modeling with exposure pathway modeling within a probabilistic framework.
Interpretation of biomonitoring data
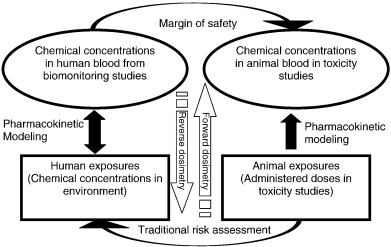
Figure: Interpretation of biomonitoring data (Clewell et al. 2008)
An additional reason for which PBPK modeling is necessary for the interpretation of biomonitoring data is that PBPK models by quantifying the ADME procedure are the only way available to us for defining the quantitative links between the timing of exposure(s) and sampling. Tracked biomarkers (either the parent compound or the metabolites) have a concentration profile varying through the day depending on the exposure profile and the kinetics of elimination-clearance (a related example is described in Paragraph A.5.3.3).
Although forward prediction of biomarker levels due to exposure is a reasonable expectation, the reverse procedure is a very demanding task as much as it is important. The difficulties are not limited only to the specificity and the sensitivity of the biomarker of choice, but also on the numerical frame that it is needed. Nevertheless, some techniques currently under development (Georgopoulos et al. 1994; Georgopoulos et al. 2009) allow the assessment of exposure levels to some extent through “inverse modeling” techniques.
Inverse modeling by reversing a PBPK model is not as easy as it may seem at first sight. PBPK models are compiled by a large set of differential equations, and the more refined the model, the larger the set. Thus, the re-built of a complex PBPK model to work backwards is almost impossible, unless it is a very simple model as the one by Rigas (Rigas et al. 2001), who used urinary biomarker data and the inverse solution of a simple, two-compartment toxicokinetic (PK) model for chlorpyrifos (CPF) to estimate the magnitude and timing of doses, based on the Minnesota Children’s Pesticide Exposure Study (MNCPES, but the compromises made in the detail of the model are reflected in the overall backwards capability.
As a result, attempts in inverse modeling are focused in computational numerical techniques. Georgopoulos (Georgopoulos et al. 1994) used the maximum likelihood estimation (MLE) method in conjunction with PBTK modeling for reconstructing short-term (30 min) exposure to chloroform, and to resolve the total dose between two routes of uptake (i.e. inhalation and dermal absorption). In a further elaborated approach, Roy and Georgopoulos (Roy and Georgopoulos 1998) used the combined MLE–PBTK modeling approach with synthetic biomarker data and demonstrated that it is mathematically feasible to reconstruct longer term exposures to VOCs.
Some recent studies on population-level exposure reconstruction focused on data sampled from distributions of biomonitoring studies such as NHANES using direct deconvolution of biomarker distributions assuming a linear response (Tan et al. 2006), or a brute-force Monte Carlo sampling approach (Sohn et al. 2004; Tan et al. 2007). However, simplifying assumptions such as linearity are known to produce erroneous exposure characterizations in the forward mode of analysis and therefore they should be considered with great caution in the inverse mode of analysis (Georgopoulos et al. 2009).

Figure: Schematic of the genralised Monte Carlo approach to reconstruct exposure from biomonitoring data (Clewell et al. 2008)
From the above, it is clear that a MLE-PBTK modeling approach has the ability to derive the best results for assessing the problem in inverse modeling